Note
Click here to download the full example code
Text symbols
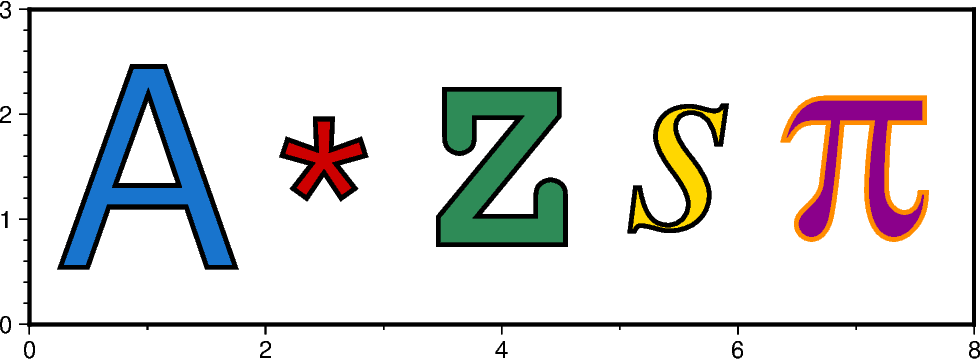
The pygmt.Figure.plot method allows to plot text symbols. Text is
normally placed with the pygmt.Figure.text method but there are times
we wish to treat a character or even a string as a plottable symbol.
A text symbol can be drawn by passing lsize+tstring to
the style parameter where size defines the size of the text symbol
(note: the size is only approximate; no individual scaling is done for
different characters) and string can be a letter or a text string
(less than 256 characters). Optionally, you can append
+ffont,outlinecolor to select a particular font [Default is
FONT_ANNOT_PRIMARY] and outline color [Default is black] as well
as +jjustify to change the justification [Default is CM]. The fill
color of the text symbols can be set with the color parameter, and the
outline width can be customized with the pen parameter.
For all supported octal codes and fonts see the GMT cookbook
https://docs.generic-mapping-tools.org/latest/cookbook/octal-codes.html and
https://docs.generic-mapping-tools.org/latest/cookbook/postscript-fonts.html.

Out:
<IPython.core.display.Image object>
import pygmt

fig = pygmt.Figure()

fig.basemap(region=[0, 8, 0, 3], projection="X12c/4c", frame=True)

pen = "1.5p"
# plot an uppercase "A" of size 3.5c, color fill is set to "dodgerblue3"
fig.plot(x=1, y=1.5, style="l3.5c+tA", color="dodgerblue3", pen=pen)
# plot an "asterisk" of size 3.5c, color fill is set to "red3"
fig.plot(x=2.5, y=1, style="l3.5c+t*", color="red3", pen=pen)
# plot an uppercase "Z" of size 3.5c and use the "Courier-Bold" font,
# color fill is set to "seagreen"
fig.plot(x=4, y=1.5, style="l3.5c+tZ+fCourier-Bold", color="seagreen", pen=pen)
# plot a lowercase "s" of size 3.5c and use the "Times-Italic" font,
# color fill is set to "gold"
fig.plot(x=5.5, y=1.5, style="l3.5c+ts+fTimes-Italic", color="gold", pen=pen)
# plot the pi symbol (\160 is octal code for pi) of size 3.5c, for this use
# the "Symbol" font, the outline color of the symbol is set to
# "darkorange", the color fill is set to "magenta4"
fig.plot(x=7, y=1.5, style="l3.5c+t\160+fSymbol,darkorange", color="magenta4", pen=pen)

fig.show()
Total running time of the script: ( 0 minutes 1.543 seconds)